Mechanical Properties of Steels
Mechanical Properties of Steels
The most important properties of steels which account for their widespread use are their mechanical properties. These properties include a combination of very high strength with the ability to bend rather than break. Different tests have been developed to describe the strength and ductility (a measure of bendability) of steels. A number of these tests which are used to describe the mechanical properties of steels are described below.
Tensile testing
Tensile testing of steel is a kind of a testing done for the evaluation of the strength of steels. A length of the steel material, usually a round cylindrical rod, is pulled apart in a machine that applies a known force, F. The machine has grips which are attached to the ends of the cylindrical steel rod, and the force is applied parallel to the axis of the rod, as shown schematically in Fig 1. As the force increases, the rod gets longer, and the change in length is represented as delta l (? l), where the symbol delta (?) means ‘a change in’ and the l refers to the original length of the rod. If a force of 50 kg is applied to two rods of the same steel material, where one is thin and the other thick then the thin rod elongate more. To compare their mechanical properties independent of rod diameter, the term ‘stress’ is used. Stress is simply the force divided by the cross-sectional area of the rod. When the same stress is applied to the thin and thick rods, they elongate the same amount, because the actual force applied to the thick rod is now larger than that applied to the thin rod by an amount proportional to its larger area. Because stress is force per area, its unit is Pascal (Pa) or N/sq m. However, the usual unit commonly used for describing the stress of the steel materials is mega-pascal (MPa) or N/sq mm (1 MPa = 1 N/sq mm).
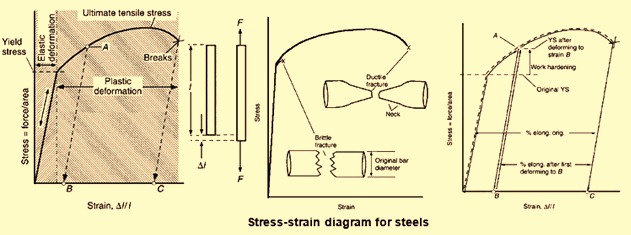
Fig 1 Stress- strain diagram for steels
When a steel material is pulled along its axis, the applied force is called a tensile force, and the machine that applies the force is called a tensile testing machine. Fig 1 shows a typical result obtained from a tensile test of a sample of steel material. The applied stress is plotted on the vertical axis while the change in length is plotted on the horizontal axis. It is usual to plot the fractional change in length, delta l/l (? l/l), as shown in Fig 1. The fractional change in length is called the strain, and the diagram in Fig 1 is called a stress-strain diagram.
The stress-strain diagram is generally divided into regions, as shown in Fig 1. These regions are the elastic region and the plastic region. As the stress on the steel sample increases, the sample elongates, and as long as the stress is not too high, release of the stress returns the steel sample to its original length. This is called elastic deformation. However, if the applied stress reaches a critical level, called the yield stress (YS), the steel material gives in and two things happen namely (i) the increase in stress needed to produce a given small increase in strain becomes lower, and (ii) on release of the stress, the sample is permanently elongated, as shown by the arrowed line A-B in Fig 1. In this case, the sample is stressed to point A, and after releasing the stress, the sample is elongated from its original length by a percent (%) given as B × 100. As shown in the figure, the increase in stress needed to continue elongating the sample reaches a maximum value in the plastic region and then drops a little before the stress is able to break the sample in two pieces. This maximum stress value is normally called the ultimate tensile strength (UTS) or often just the tensile strength (TS).
The stress-strain diagram also provides an additional measure of the mechanical properties of the steel material. The ductility is the amount of elongation which occurs after the stress increases beyond the YS and before the sample breaks. This elongation is sometimes called permanent elongation, because it remains in the sample after breakage and can be measured easily. The permanent elongation in the sample in Fig 1 after the elastic strain is relaxed is given by point C. By simply multiplying the strain at C by 100, the ‘% elongation’ of the steel material is obtained.
Fig 1 also presents possible stress-strain diagrams for a ductile and a brittle steel material. The breakage strain is much larger for the ductile steel material, and the % elongation is much larger. The figure also shows that the diameter of the steel sample at the fracture surface of a brittle failure remains close to its original value, while that of the ductile failure is reduced. This reduction in diameter by plastic flow near the fracture surface is referred to as necking, and it develops in ductile steel material just before fracture. In addition to % elongation, ductility is often characterized by % reduction in area, which is simply the % by which the original cross-sectional area of the steel sample is reduced at the fractured neck.
The concept of ductile versus brittle behaviour is quite obvious and can be seen by hammering the exposed end of a sample fixed in a vice. In case of a brittle steel material, the sample breaks almost immediately, whereas in case of a ductile steel material, the sample is bent by the hammer blows and may not break even after bending 90 deg or more. Further if the sample is hammered back and forth, it can be noticed that after the material has been deformed a little, it becomes more difficult to deform further. This effect is called work hardening and can be understood from the stress-strain diagram in Fig 1. The stress-strain diagram for the original (un-deformed) material is shown by the dotted line. If the original sample is deformed to point A, it has strain equivalent to point B when the stress is released. If this sample is retested, it can be notices that its YS has increased from the original value up to point A, as shown on the diagram. This increase in YS is a measure of the work hardening resulting from the original deformation (work) put into the steel material during the first deformation.
It can be seen that although the steel material is now stronger in the sense that it has to be stressed more before it undergoes plastic deformation, its UTS is not changed significantly, and it is less ductile, that is, its % elongation to failure has gone down. It is the general characteristic of the steel materials which shows that processes which increase their YS also decrease their ductility. This means that heavily work hardened steel materials often break easily. A familiar example of this behaviour is the frequently used method of breaking a steel wire by bending it back and forth many times.
The mechanical properties of steels are usually shown by listing values of their YS, TS, and % elongation. The data on the mechanical properties of normalized steels shows two general characteristics of steels namely (i) increasing the % carbon (C) in steel increases both YS and TS, and (ii) increasing % C drops the ductility (% elongation). Similarly a comparison of the as-rolled properties to the normalized properties shows the effects of work hardening. This comparison shows that YS increases at higher C levels, TS is changed only slightly, and % elongation drops a little.
Hardness testing
A problem with the tensile testing is that the material is destroyed by the test. Another testing method which characterizes the strength of a steel material but does not destroy the material is the hardness test. This test is used widely because it is quick and can be applied to parts that can then be placed into service.
Over the years, several different, useful hardness testing methods have been developed, and the essential features of these testing methods are explained in Fig 2. A hard material, called the indenter, is forced into the steel material surface with a fixed load (weight). The region of steel material located under the indenter point is deformed to strains which are well into the plastic region of Fig 1, so that permanent deformation is generated, causing a crater (called an indent) to be left in the surface of the steel material. The hardness is then defined by some number which is proportional to the size of the indent. In some methods, the size of the indent is measured from its diameter, and in others, it is measured from the depth of the indent. There are various indentation hardness tests which are used for measuring the hardness of steel materials.
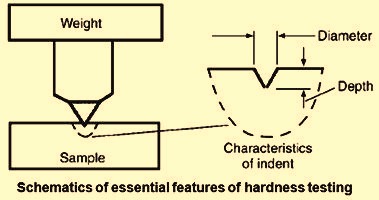
Fig 2 Essential features of hardness testing
The different hardness tests are described below.
- Rockwell hardness test – The Rockwell hardness test is probably the most widely used test. There are three most common scales for the Rockwell hardness test. Both the ‘C’ and ‘A’ scales use a conical diamond indenter, with the only difference being that the ‘A’ scale uses a lighter load. These tests provide a very quick and easy measurement, with the testing machine measuring the depth of penetration automatically and providing the hardness value either on a dial or, in modern testing machines, as a digital readout. The smaller load for the ‘A’ scale reduces the penetration depth and is often used to measure hardness on steel surfaces that have been case hardened with a thin, hard layer on the surface. The reported hardness values are referred to as RC or HRC and similarly RA or HRA. The indenter for the ‘B’ scale is a 1.6 mm hardened ball and this scale is sometimes used for soft steel materials.
- Brinell hardness test – It is a more reliable hardness test for soft-to-medium hard steels. It uses a larger ball made of either hardened steel or tungsten carbide, for indentation, and the diameter of the indent is measured. This test is a two step test in that the indent needs to be made first and then the indent diameter measured optically. The size of the indent is required to be between 3 mm to 6 mm. The Brinell hardness number (referred to usually as HB or BHN) is then determined either from a table or by using an equation. An advantage of the Brinell hardness test is that it measures hardness over a much larger area than the Rockwell hardness test, which is useful for materials with coarse microstructures, such as cast irons. However, this is also a disadvantage for application where the test piece is usually small, such as the tooth of a gear. Another disadvantage is that the test is not useful at the higher hardness ranges of steel materials. There is information available in standards which compares HRC values measured on steel with the corresponding equivalent hardnesses measured for steel by various other hardness tests.
- Vickers/Diamond pyramid hardness test – There is another test developed in England and generally used there in preference to the Rockwell test, called the Vickers hardness test. This test is similar to the Brinell test in that it is a two-step test measuring the diameter of the indent, but with a diamond indenter shaped in the form of a pyramid. The pyramid geometry produces an indent having a square shape, and the size is measured by the length of the diagonals of the square indent. The average diagonal length and the load used are put into a formula which calculates the Vickers hardness (HV) number, also called the diamond pyramid hardness (DPH) number. The Vickers test is the only one that applies at all hardness levels.
- Micro-hardness test (Diamond pyramid and Knoop) – There is a micro-hardness test available. The test uses very light loads and makes indent diameters small enough to fit into micro-sized regions. It uses a microscope that allows the indent to be positioned at desired locations on a microstructure, and the size of the indent is measured with the same microscope. There are two different indenters used in micro-hardness testing. They are the diamond pyramid indenter of the Vickers test and a special-shaped indenter called a Knoop indenter. Fig 3 explains the use of the diamond pyramid (Vickers) hardness test on a ferrite-pearlite banded steel material. Indents are placed in a ferrite band and in a pearlite band. It can be seen that the indent is smaller in the pearlite band, indicating that the pearlite is harder than the ferrite. The weight used in this test is to be adjusted to 50 g to keep the indent small enough to fit inside the bands. The micro-hardness test uses the same equation as the Vickers hardness test to calculate hardness, HV, and the values found are HV = 260 in pearlite and HV = 211 in ferrite. Comparing this, these values correspond to HRC values of 24 in pearlite and 13.6 in ferrite. The second image in Fig 3 presents results from a similar test on ferrite-pearlite banded steel with higher sulphur (S), using the Knoop indenter. This steel sample contains significant amounts of sulphides due to higher S, as shown in the figure. The sulphides are ductile at the hot working temperature and become elongated during hot working. The sulphides make the steel machine more easily. It can be seen that the Knoop indenter is quite oblong in shape. This allows it to fit into thin layers more easily than a Vickers indent. Therefore, it is particularly useful for microstructures with thin layer morphologies. Hardness is characterized with its own set of Knoop hardness numbers, which can be related to HRC values in comparison tables.
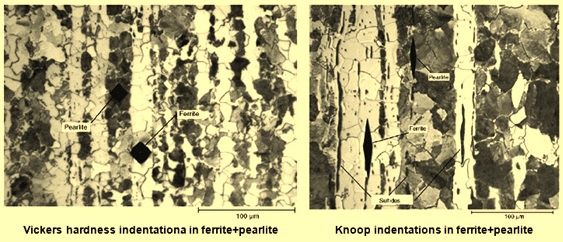
Fig 3 Micro-hardness testing of steels
The indentation hardness numbers correlate well with the UTS of quenched and tempered steels. The correlation becomes less reliable at HRC values above 55, but the figure usually shown in tables shows the UTS values that are obtained by extrapolating the curve to the HRC values of 60 and 65. The results show that when a steel material is hardened into the range of HRC = 60 to 65, the corresponding tensile strengths are extremely high, 2450 N/sq mm and 2850 N/sq mm at HRC = 60 and 65, respectively.
While estimating the maximum hardness for the various microstructures in steels it can be seen that both ferrite and austenite are fairly soft. The hardness of pearlite is controlled by its spacing, and the values of 40 to 43 are obtained for pearlite with the finest spacing that can be obtained on cooling. Finer spacing can be obtained in pearlitic steels by mechanically deforming this pearlite to thin wire form and winding into cable. Such pearlitic steel cable is used in wire rope, which has TSs of 2200 N/sq mm. Quenched and tempered steel wire can be made to this strength level, but experience has found the pearlitic wire to be tougher, and for that reason, it is the wire of choice for such industrial applications as bridges and crane cables. Lower bainite has hardnesses approaching that of martensite and also finds industrial uses because of its slightly superior toughness to that of quenched and tempered steels. Martensite has the highest strength and hardness of all, and the hardness of fresh martensite depends on the % C in the steel. Fresh martensite is rarely used industrially because of its lack of toughness. It is tempered (heated to modest temperatures), which lowers its strength but increases its toughness. Measurement of hardness is a major method of control of the tempering process.
Notched impact testing
During World War II, the need for higher production rates of warships led to construction using welded steel plate rather than the standard riveted construction. The brittle failure in the welded plates of these ships produced spectacular failures, where the entire ship broke in half, with catastrophic results. Cracks began at local points in the welded joints and propagated around the ship, passing from plate to plate and causing failure by a brittle mode, that is, little to no plastic flow. This brittle behaviour was not detected by a sudden loss in ductility in the simple tensile test. These disasters led to a wide appreciation of the fact that ductility as measured by the tensile test is not a good measure of susceptibility to brittle behaviour in complex steel parts.
Ferritic steels, with their body-centered cubic (bcc) structure, have the disadvantage of breaking in a brittle fashion at low temperatures. This means, in terms of the ideas of the tensile test that the % elongation at failure is close to zero. As the temperature is lowered, there is a small temperature range over which the steels with bcc structure suddenly begin to fail in the brittle mode. An average temperature of the small range, called the ‘ductile brittle transition temperature’ (DBTT), is often chosen to characterize the temperature where the transition occurs. The simple tensile test detects this transition, but unfortunately, it detects DBTT values well below those that occur in complex steel parts.
The tensile test applies stress in only one direction while in complex steel parts, the applied stress acts in all three possible directions, a situation called a tri-axial stress state. The DBTT is raised by a tri-axial stress state. A tri-axial stress state develops at the base of a notch when a notched sample is broken in a tensile machine, and such tests are called notched tensile tests. However, it is more useful to break the sample with an impact test, where the load is applied much more rapidly than in a tensile machine, because the combination of the notch geometry and the high load rate produces values of DBTT close to the temperature where brittle failure begins to occur in complex steel parts.
The Charpy impact test, as shown schematically in Fig 4, is most often used for the impact test. A V-notch is machined into a square bar and placed in the holder. The specimen is broken cleanly in two with a weighted hammer attached to the arm of a pendulum. The pendulum arm is raised to a specified height and then released. It swings down through the sample and swings up on the opposite side. By comparing the rise after breaking the sample to the rise with no sample present, the amount of energy absorbed by the specimen on breakage can be calculated. This energy, usually given in units of joules ( J), is called the Charpy impact energy, or CVN energy. It can be seen that the ‘Izod impact test’ is similar to the Charpy impact test. The main difference in the Izod impact test is that the specimen is clamped at one end, and the pendulum strikes the opposite end.
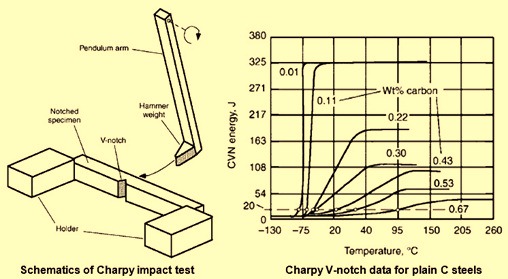
Fig 4 Charpy impact test
Figure 4 shows Charpy impact data on plain C steels which are slow cooled from the austenite region, so that the microstructures of these steels are mixtures of ferrite and pearlite. The figure shows that the Charpy impact energy is very sensitive to % C in the steels. At all compositions, there is a transition from ductile to brittle failure as the temperature drops, but at % C levels of 0.11 and below, the transition is much sharper and the CVN energy is considerably higher for the high temperature ductile mode of fracture. For steels, a CVN energy value of 20 J is often taken as the onset value for brittle failure. The dashed line in Fig 4 at 20 J shows that for this criterion, steels with % C above around 0.5 are considered brittle at room temperature. However, the DBTT predicted by the Charpy test is really only a guide to actual transition temperatures that occurs for a complex piece of steel used in the field. So, the data in Fig 4 do not mean that a steel having 0.60 % C will always fail by brittle fracture at room temperature.
It is common to refer to the CVN energy as a measure of the notch toughness, or simply the toughness of the steel. This measure of toughness is much more useful than ductility measurements, such as % elongation, for evaluating the potential of a steel material for brittle failure in service. Toughness and ductility have related but slightly different meanings, and it is high toughness that is desirable in steel parts. The toughness of steels can be improved by the factors namely (i) minimizing the C content, (ii) minimizing the grain size, (iii) eliminating inclusions, such as the sulphide stringers usually done by using steels with low impurity levels of S, P (phosphorus), and other elements, and (iv) using a microstructure of either quenched and tempered martensite or lower bainite rather than upper bainite or ferrite / pearlite.
There is a large difference in the nature of the fracture mechanism when a steel material fails in a brittle mode versus a ductile mode. In brittle failure, there is little to no plastic flow of the material prior to a crack forming and running through the steel, causing it to break into pieces. The steel seems to pull apart along the fracture surface. This sudden pulling apart occurs in one of two ways namely (i) the steel material separates along grain boundaries, or (ii) the grains of steel material are cleaved in half along certain planes of their crystal structure. These brittle fracture modes are called grain-boundary fracture and cleavage fracture and can be distinguished by looking at the fracture surface in either a low-power microscope or a scanning electron microscope (SEM).
When a steel material fails in a ductile mode, there is some plastic flow of the material prior to breakage occurring along the fracture surface. This flow causes very tiny voids to form within the steel grains. As the flow continues, these voids grow and coalesce until breakage occurs. The SEM micrographs at fairly high magnifications show remnants of the individual voids exposed on the fracture surface. The fracture is often called ‘micro-void coalescence’, for obvious reasons. If the steel contains small foreign particles, they are frequently be the site where the voids form first, and these particles are found at the bottom of the voids on one or the other of the mating fracture surfaces. Unfortunately, it is difficult to see the micro-voids on fracture surfaces with optical microscopes, because the depth of field is too shallow to image them at the high magnifications needed.
Grain-boundary fracture surfaces virtually always indicate that brittle failure has occurred, with little to no plastic flow before fracture. Cleavage fracture surfaces sometimes occur with significant plastic flow and, by themselves, do not indicate brittle failure. Micro-void coalescence fracture surfaces indicate that a ductile fracture occurred.
Fatigue failure and residual stresses
A crude but quick way to break a steel rod in two is to make a small notch across the surface with a file or a cold chisel and then bend the rod at the notch. The rod generally breaks with a single bend or may be two. When the rod is bent away from the notch, a tensile stress develops at the base of the notch that is much higher than would be present if the notch are not there, and this leads to fracture starting at the notch. The small radius of curvature at the root of the notch causes a local rise in the stress there. The sharp radius is a stress concentrator or, alternately, a stress intensifier, and the smaller the radius, the higher the stress concentration. Small surface scratches, even those too small to see by eye, can produce stress concentrations during bending, which are localized at the root of the scratch. If sufficiently high, the concentrated stress can exceed the YS locally and produce tiny cracks that have the potential to lead to failure.
This awareness can help in understanding a type of failure that occurs in steels and is called fatigue failure. Consider an axle supporting a load heavy enough to cause it to bend down slightly at its centre point between the wheels (Fig 5). This bending causes the steel to be pulled apart at the location T and also to be pushed together at the location C. This means that the steel material undergoes a tensile stress at T and a compressive stress at C. Therefore, as a point on the axle surface rotates, it undergoes a cyclic stress: tension when it is down and compression when it is up. In a well designed axle, the maximum TS is usually well below the YS, and all the strain experienced in the steel material surface during rotation is in the elastic region of the stress-strain diagram, as shown at the bottom of Fig 5.
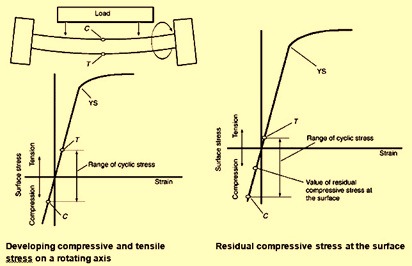
Fig 5 Compressive and tensile stresses on a rotating axis
However, if there is a very small scratch on the steel surface. If the stress is raised locally at the scratch root to a point above the YS, it can generate a crack there. Each time the axle rotates, the crack grows, and eventually, the crack becomes large enough to break the axle, a process known as fatigue failure. Fatigue failures occur in steel parts subjected to cyclic stresses, as often occurs in rotating machinery, valve and coil springs, or vibrating parts, such as aircraft wings.
When a steel bar is pulled on with a TS, the atoms of the iron grains are pulled away from each other, so that, on average, the distance between atoms increases. Similarly, if a compressive stress is applied, the average distance between atoms decreases a small amount. Hence, if the steel is stress free, there is some average distance between atoms. A steel rod lying on the bench generally is assumed to be stress free; that is, the atoms are spaced at their stress-free distance. Because the rod is just sitting there, this must be true, but only for the average distance between atoms over the whole rod. It may be that in parts of the rod, the atoms are sitting there with average distances between them greater than their stress-free distance, and in other parts, less than this value. If this is the case, the rod is said to contain residual stresses, some of them tensile and some of them compressive. Suppose, for example, that the outer millimeter of the rod is under compression. Then, below this outer 1 mm thick cylindrical region there must be some region where the atoms are under tension. In this case, there is residual stress on the surface that is compressive, with residual tension below. It is the surface where the scratches are that leads to fatigue failure. So, by producing residual compressive stresses on the surface, it is possible to reduce the crack growth during cyclic loading. As shown in Fig 5, the local residual compressive stress at the surface causes the TS on the rotating axle to decrease, because the cyclic stress produced by rotation is added to the axle, starting at the value of the residual compressive surface stress. Thus, it is very desirable to have residual compressive stresses on steel parts.
There are several ways to produce residual compressive stresses in steels. These involve heat treating and/or mechanical deformation. The heat treating technique is called flame hardening. In this technique the surface of the steel heats up much faster than its interior since an intense flame is directed at the surface. The flame heating causes a layer of the steel at the surface to become austenite, while the interior remains ferrite + pearlite. On rapid cooling with a quench of some sort, the surface layer transforms to martensite, while the inner region remains ferrite + pearlite. Martensite has a lower density than the austenite from which it forms. Hence, the outer layer expands when martensite forms. The inner region resists this expansion, causing the atoms in the outer layer to be forced closer together than they want to be, and a residual compressive stress is formed in the outer martensitic layer. An alternate way of heating the surface layer much faster than the interior is by induction heating. A copper coil is placed at the surface of the steel, and a high- frequency current is passed through the coil. The magnetic field generated by this current induces currents in the steel surface, causing localized surface heating. This technique is widely used in industry. It is so effective that axles used in automobiles are routinely induction hardened, not for increased surface wear resistance but simply for improved fatigue life.
Residual compressive stresses can also be produced on heat treating, due simply to thermal expansion / contraction effects that occur on heating and cooling. If a round steel bar is quenched, the outer surface thermally contracts faster than the interior. The interior resists the contraction of the outer surface and pushes it into tension. If the tension is large enough to cause plastic flow in the outer surface, a stress reversal occurs on further cooling, and the result is a residual compressive stress on the outer surface.
As with flame hardening and induction hardening, the end result is a desirable residual compressive surface stress. However, if a phase transformation occurs on cooling, things become more complicated. So, for steels, the compressive residual surface stress is assured if the steel is not heated above the A1 temperature before quenching. Heating above A1 generates austenite, which complicates matters due to the formation of martensite on quenching. If martensite forms only in an outer surface layer on quenching, then a surface residual compressive stress is obtained. However, if martensite develops all the way to the centre of the bar (a condition called through hardening), the result is a residual surface tensile stress, an undesirable situation.
There are many surface treatments that are given to steels. The two most common such treatments involve carburizing and nitriding. These treatments are usually done to produce hardened layers on the surface that reduce surface wear rates. These treatments also enhance the formation of residual compressive stresses, which is incidental benefit accompanying the increased surface hardness.
Residual surface compressive stresses can also be generated by mechanical means. Perhaps the most common technique employed in industry is shot peening. The technique involves bombarding the steel surface with small steel balls (shot). This action causes localized plastic flow at the surface, resulting in the desired residual surface compressive stress. Steel toughness is enhanced by surface residual compressive stresses. An example involves the high-strength pearlitic wire used in cables.
In general, pearlitic steel is not as tough as quenched and tempered martensitic steels. Yet, the high-strength pearlitic wire used in bridge and crane cables displays superior toughness compared to quenched and tempered martensitic wires of the same hardness. The improved toughness of the pearlitic wire is thought to arise from the drawing operation used to refine the pearlite spacing, which is necessary to achieve the high strength. Apparently, the wire-drawing operation produces residual surface compressive stresses that result in the improved toughness.

Leave a Comment