Instrument Analysis of Steel, Slag and Raw Materials
Instrument Analysis of Steel, Slag and Raw Materials
Instrument analysis is widely used for the qualitative and quantitative elemental analysis of raw materials, iron (hot metal), steel, slag, refractories, and sludges samples. Compared to the wet analysis, the advantage of instrument analysis is that it is cost effective and multi elemental besides being very fast. The worries caused by interfering elements in the wet chemical analysis are eliminated. Instrument analysis avoids the need of waiting several hours for certain elements, which is a necessity when the wet chemical methods are employed.
Furthermore, instrument analysis provides a fairly uniform detection limit across a large list of elements or compounds and is applicable to a wide range of concentrations, ranging from 100 % to few parts per million (ppm). The instrumental methods are reproducible with lesser scope of human error because of lesser human intervention. They are rugged, reliable and accurate with the accuracy depends upon the calibration and the standards used for the calibration.
The analysis of steel, slag and raw materials is important and essential not only during steel making process for the purpose of control but also for the large number of samples needed to be analyzed for various other purposes. The information from an analysis is useful for various purposes, such as the inspection of raw materials, intermediate product and end product, environmental assessment, process control, failure analysis, quality control of the products and for the purpose of research and development.
History
While the spectrograph had been used for quite some time in other fields, the first instrument to be used successfully for ferrous melting control was installed in a foundry in 1935. A Baird Spectrograph was installed in the Timken laboratory in 1943 for the analysis of tests from the melt shop. This instrument was equipped with a three meter focal length Wood’s grating, ruled 15,000 lines per inch, set in an eagle mounting. Samples for spectrographic analysis are cast in the form of rods, 5.5 mm in diameter, by pouring the liquid metal into a mould or sucking it up in a glass tube. The cast pins are sent to the laboratory by a pneumatic tube transport system, where they are carefully ground to a point of 140 degrees included angle and placed in the electrode holders. Power from a high voltage arc or spark source is applied and spectral lines from the emitted light are photographed on Eastman spectrum analysis number 1 plates. The plate is then developed, washed, dried and cooled to room temperature in a dark room. The density of the line for the element required is read on a densitometer and calculated to percent, after which it is reported by telautograph to the furnace operator.
Further development in instrument analysis was the direct reading spectrometer. In this instrument, the photographic stage has been entirely replaced by sensitive electron multiplier tubes, which pick up the emitted light at the various wavelengths and report it as percentage on calibrated clock dials within 35 seconds after a sample has been placed in the electrode holders. The use of photo tubes eliminated all of the possible errors associated with plates or film, dark room developing and processing, densitometer readings and calculating boards. The first direct reading spectrometer was installed in the Timken control laboratory in May 1947 and was the first instrument of this type to be used in the steel industry.
Further development took place in the instrument analysis and the different types of instrument analysis presently in use are described below.
Spark atomic emission spectrometry (AES)
Atomic emission spectroscopy is a method of chemical analysis that uses the intensity of light emitted from a spark at a particular wavelength to determine the quantity of an element in a sample. The wavelength of the atomic spectral line gives the identity of the element while the intensity of the emitted light is proportional to the number of atoms of the element.
Spark atomic emission spectroscopy is used for the analysis of metallic elements in solid samples. For non conductive materials, the sample is ground with graphite powder to make it conductive. In traditional arc spectroscopy methods, a sample of the solid is normally ground up and destroyed during analysis. An electric arc or spark is passed through the sample, heating it to a high temperature to excite the atoms within it. The excited atoms emit light at characteristic wavelengths that can be dispersed with a monochromator and detected. The spark source with controlled discharge is for quantitative analysis. Both qualitative and quantitative spark analyses by spark atomic emission spectrometry are widely used for the purpose of quality control in steel plants.
AES can determine as many as up to 64 elements simultaneously in less than 20 seconds. The limitation of this technique is that the instrument cannot analyze gases in steel (oxygen, nitrogen and hydrogen). Though some of the modern day instruments provide nitrogen analysis, the reproducibility and detection limits are below the expectations of the steel makers.
X-ray fluorescence (XRF) spectrometry
This spectrometer can analyze both metals and non-metallic samples. Hence, it is extensively used for the analysis of metals, slags, raw materials, and refractory samples. It works on the following principle (shown in Fig 1).
When a sample is irradiated with X-rays from an X-ray tube, the atoms in the sample generate unique X-rays that are emitted from the sample. Such X-rays are known as ‘fluorescent X-rays’ and they have a unique wavelength and energy that is characteristic of each element that generates them. Consequently, qualitative analysis can be performed by investigating the wavelengths of the X-rays. As the fluorescent X-ray intensity is a function of the concentration, quantitative analysis is also possible by measuring the amount of X-rays at the wavelength specific to each element.
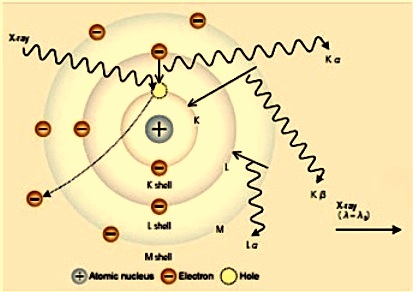
Fig 1 Principle of XRF spectrometry
An X-ray from the tube is impacting in the sample where it interacts with an electron from one of the inner shell of the A atom. It knocks the electron out of its orbital. This leaves a void which is then promptly filled by an electron from an outer shell. This electron has a higher energy than the electron it is replacing. The excess energy is expelled in the form of an X-ray with a wavelength specific for the atom of A. XRF spectrometers are mainly of two types.
Energy dispersive X-ray fluorescence (EDXRF ) spectrometer uses a detector to process directly the complete spectrum into an energy dispersive scale. EDXRF spectrometers include a high tech detector using a Silicon Lithium (SiLi) drifted crystal cooled at low temperature (-90 deg C). This crystal is able to discriminate between X-ray photons of different energies (energy dispersion). Detector picks up all the photons emitted by the sample and total detector count rate is around 50 kilo counts per second and is often saturated. Specific filters are usually used to filter out part of the spectrum, e.g. the major elements. Secondary targets are normally used to better excite only a part of the elements of the periodic table.
SiLi crystal of the detector absorbs an incoming X-ray photon which ionizes atoms and produces electron (-) and hole (+) pairs. Amount of electron/hole pairs is proportional to the energy of the X-ray photon. Detector output pulses are amplified, digitized and sorted depending on their magnitude. It is necessary to cool detector at minus 90 deg C.
Wavelength dispersive X-ray fluorescence (WDXRF) spectrometer uses appropriate crystals to separate the emission spectrum into discrete wavelengths before detecting them. Micro X-ray fluorescence gets its name because these instruments are designed to analyze very small spot sizes. In total reflection X-Ray fluorescence (TRXRF) the excitation beam is totally reflected by the substrate and only particles on the surface are excited giving rise to X-ray fluorescence emissions. In this way the background normally associated with XRF measurements is much reduced, leading to higher sensitivity and lower detection limits.
Inductively coupled plasma atomic emission spectrometry (ICP/AES)
Inductively coupled plasma atomic emission spectrometry is an analytical technique used for the detection of trace elements. It uses the inductively coupled plasma to produce excited atoms and ions that emit electromagnetic at wavelengths characteristic of a particular element. The intensity of this emission is indicative of the concentration of the element within the sample.
The ICP-AES consists of two parts namely (i) the ICP, and (ii) the optical spectrometer. The ICP torch consists of 3 concentric quartz glass tubes. The output of the radio frequency (RF) generator surrounds part of this quartz torch. Argon (Ar) gas is typically used to create the plasma.
The RF generated and maintained Ar plasma, portions of which are as hot as 10,000 deg K, excites the electrons. The plasma is used to atomize and ionize the elements in the sample. When the electrons return to ground state at a certain spatial position in the plasma, they emit energy at the specific wavelengths peculiar to the elemental composition of the sample. Light emitted from the plasma is focused through a lens and passed through an entrance slit into the spectrometer. There are two types of spectrometers used in ICP-AES analysis namely (i) sequential (monochromator), and (ii) simultaneous (polychromator).
Inductively coupled plasma mass spectrometry (ICP-MS) is a very powerful tool for trace (ppb, parts per billion-ppm) and ultra-trace (ppq, parts per quadrillion -ppb) elemental analysis.
Atomic absorption spectrometry (AAS)
Atomic absorption spectrometry (AAS) is an analytical technique that measures the concentrations of elements. Atomic absorption spectrometry is normally used to analyze the concentration of over 62 different metals in a solution and is so sensitive that it can measure down to parts per billion of a gram in a sample. The technique makes use of the wavelengths of light specifically absorbed by an element. They correspond to the energies needed to promote electrons from one energy level to another, higher, energy level.
An atomic absorption spectrophotometer consists of a light source, a sample compartment and a detector. In this method, light from a source is directed through the sample to a detector. The source of light is a lamp whose cathode is composed of the element being measured. Each element requires a different lamp.
The technique makes use of absorption spectrometry to assess the concentration of an analyte in a sample. It requires standards with known analyte content to establish the relation between the measured absorbance and the analyte concentration and relies therefore on the Beer Lambert law which is explained below.
A = eBC
Where A is absorbance [no units, since A = log10 (Io / I1)], e is the molar absorbtivity with units of L mol¯¹ cm¯¹, B is the path length of the sample in centimeters – that is, the optical path length, and C is the concentration of the compound in solution, expressed in mol L¯¹.
The diagram (Fig 2) shows a beam of monochromatic radiation of radiant power I?, directed at a sample solution. Absorption takes place and the beam of radiation leaving the sample has radiant power I1.
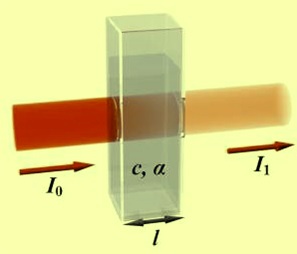
Fig 2 Diagram showing monochromatic radiation
In short, the electrons of the atoms in the atomizer can be promoted to higher orbitals (excited state) for a short period of time (nanoseconds) by absorbing a defined quantity of energy (radiation of a given wavelength). This amount of energy, i.e., wavelength, is specific to a particular electron transition in a particular element. In general, each wavelength corresponds to only one element, and the width of an absorption line is only of the order of a few picometers (pm,10¯¹² m), which gives the technique its elemental selectivity. The radiation flux without a sample and with a sample in the atomizer is measured using a detector, and the ratio between the two values (the absorbance) is converted to analyte concentration or mass using the Beer-Lambert law.

Leave a Comment