Carbon Steels and the Iron-Carbon Phase Diagram
Carbon Steels and the Iron-Carbon Phase Diagram
Steels are alloys having elements of iron (Fe) and carbon (C). C gets dissolved in Fe during the production of steels. Pure Fe melts at a temperature of 1540 deg C, and at this temperature, C readily dissolves into the liquid iron, generating a liquid solution. When this liquid solution solidifies, it generates a solid solution, in which the C atoms are dissolved into the solid iron. The individual C atoms lie in the holes between the Fe atoms of the crystalline grains of austenite (at high temperatures) or ferrite (at low temperatures). Austenite has a face centred cubic (fcc) structure while the ferrite has a body centred cubic (bcc) structure (Fig 1). If the amount of C dissolved in the liquid iron is kept below 2.1 %, the product is steel, but if it is above this value, then the product is cast iron. Although liquid iron can dissolve C at levels well above 2.1 % C, solid iron cannot. This leads to a different solid structure for cast irons (iron with total C greater 2.1 %).
In addition to C, all the types of steels contain the element manganese (Mn) and low levels of the impurity atoms of phosphorus (P) and sulphur (S). Hence, steels can be considered as alloys of three or more elements. These elements are Fe, C, other element/elements additions, and impurities. It is normal to classify steel compositions into two categories namely (i) plain C steels, and (ii) alloy steels. In plain C steels, other elements consist only of Mn, P, and S, whereas in alloy steels, one or more additional alloying elements are added.
Solid solutions are similar to the liquid solution; that is, after the solid substance is dissolved, its presence is no longer evident to a viewer as it had been previous to its dissolving (Fig 1). The C atoms fit into the holes that exist between the Fe atoms of the face centered cubic (fcc) austenite present at this temperature. This solid solution of C in Fe is the carbon steel. Fig 1 locates the centre of the Fe atoms in the fcc lattice. If each of the little solid dots are allowed to expand until they touch each other, the result is the model of fcc iron as shown in the Fig 1 (right side). The expanded Fe atoms touch each other along the face diagonals of the cube. The small open circles locate the centre of the void spaces between the iron atoms. If these small circles are expanded until they touch the iron atoms, their maximum diameter is equal to 41.4 % of the Fe atom diameter. This means that atoms smaller than roughly 42 % of the Fe atom diameter can fit into the holes between the Fe atoms. C atoms are small, but the diameter of C atoms is estimated to be 56 % of the diameter of Fe atoms in austenite. Hence, when C dissolves in iron, it pushes the Fe atoms apart a small amount. The more C gets dissolved, the further the Fe atoms are pushed apart. Thus, there is a limit to how much C can be dissolved in the iron.
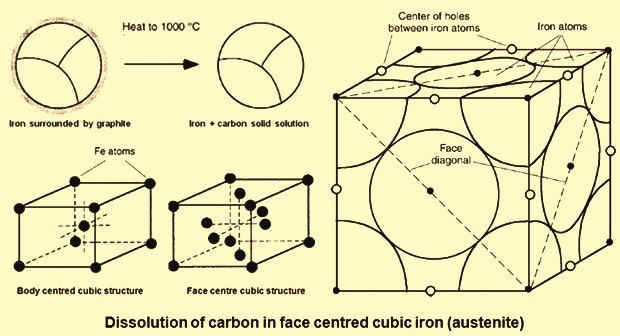
Fig 1 Structure of iron and dissolution of carbon in face centred cubic iron
In pure iron, the difference in ferrite and austenite is a difference in their atomic structures. The Fe atoms are arranged with a body-centered cubic (bcc) crystal structure in ferrite and an fcc crystal structure in austenite. In both ferrite grains and austenite grains, this atomic structure does not change within the grain. Both ferrite and austenite are individual phases. When C is added to austenite to form a solid solution, the solid solution has the same fcc crystal structure as in pure iron. The C from the graphite (Fig 1) just fits in between the iron atoms. The crystal structure remains fcc, the only change being that the Fe atoms are pushed very slightly farther apart. Both pure austenite and austenite with C dissolved in it are the same phase. Thus, austenite (with C dissolved in it), and ferrite (with C dissolved in it) are two different phases, both of which are steel.
Low carbon steels – Hypo-eutectoid steels
The Fe-C phase diagram provides temperature-composition map of where the two phases (austenite and ferrite) occur. It also indicates where mixtures of these two phases can be expected. The Fe- C phase diagram is shown in Fig 2. In pure iron, austenite transforms to ferrite on cooling to 912 deg C.
This transition temperature is traditionally called the A3 temperature, and the diagram shows that adding C to Fe lowers the A3 temperature. Whereas the maximum lowering occurs at what is called the eutectoid point which is also known as the pearlite point. The eutectoid point represents the temperature and composition on the phase diagram where a eutectoid reaction occurs, that is, a reaction where one solid transforms into two solids. The eutectoid point in the Fe- C system has a composition of around 0.76 % C, and steels with compositions less than this value are called hypo-eutectoid steels. The eutectoid temperature is traditionally called the A1 temperature.
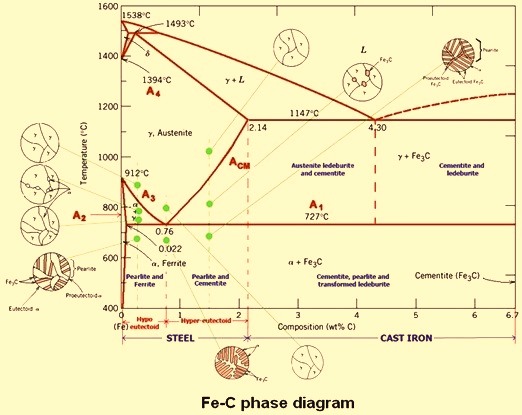
Fig 2 Iron- carbon phase diagram
Steels that are 100 % austenite must have temperature-composition coordinates within the area of austenite shown in the phase diagram at Fig 2. Steels that are ferrite must have temperature-composition coordinates in the narrow region at the lower left of the Fe-C phase diagram. The maximum amount of C which dissolves into the ferritic iron is only 0.022 %. This occurs at the eutectoid temperature of 727 deg C. This means that ferrite is essentially pure iron, because it is always 99.978 % or purer with respect to carbon. It can be seen, however, that austenite may dissolve much more C than ferrite. At the eutectoid temperature, austenite dissolves around 0.76 % C, which is roughly 38 times more C than ferrite will hold at this temperature. Austenite holds more C than ferrite, because the holes between iron atoms are larger in the fcc structure than the bcc structure.
The central region on the left side of the Fe-C phase diagram maps temperature-composition points where steel consists of a mixture of ferrite and austenite. Suppose a hot stage microscope is used to look at polished steel having a composition of 0.4 % C after it had been heated to 760 deg C. Because this temperature-composition point lies in the central region, the steel must be a mixture of ferrite and austenite, two examples of which are shown at the left side of the Fe-C phase diagram.
The portion of the phase diagram in hypo- eutectoid region is shown in Fig 3. It provides information about the composition of the two phases. The austenite grains have the composition given as N and the ferrite the composition given as M in Fig. 3.
As a further example of the usefulness of the phase diagram, a simple experiment can be considered. A steel of composition 0.4 % C is first heated to 850 deg C and held for approximately 10 minutes. After this short hold, all the grains in this steel would consist of pure austenite grains (fcc structure) with a composition of 0.4 % C. To make the example simpler, it can be imagined to be looking at the steel in a hot stage microscope and seeing a region of only three grains, as shown in Fig.3. Now, the hot stage temperature is reduced to 760 deg C, and the sample slowly cools to this temperature. There is change in the microstructure due to the cooling. According to the phase diagram, the steel, after cooling, becomes two phases, a mixture of austenite and ferrite. Experiments show that the ferrite that forms in the pure austenite as it cools virtually always forms on the austenite grain boundaries. This is shown in the microstructure in Fig. 3 (right side), where the ferrite has formed as a number of alpha grains along the prior-austenite grain boundaries.
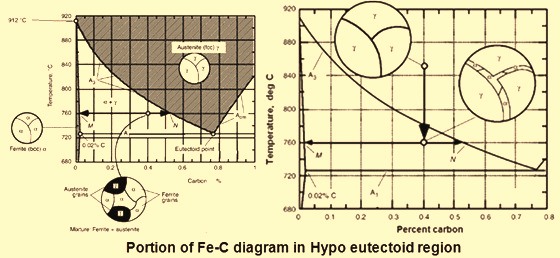
Fig 3 Portion of the phase diagram in hypo eutectoid region
Comparing this microstructure of Fig. 3 with the microstructure at the bottom of Fig. 3 (at the left side) reveals similarities and differences. They are similar in that both contain a mixture of ferrite and austenite grains with the same volume fraction of each, but they are different in that the distribution of the ferrite grains is quite different. The microstructure at the bottom of Fig. 3 (left side) is normally formed on heating the steel from room temperature to 760 deg C. This example explains one of the interesting aspects of steels that the microstructure can be controlled by heat treatment and it is known that the mechanical properties of steels are controlled by microstructure. The microstructure of steel generally refers to the specific shape, size, distribution, and phase types of the grains in the steel.
High carbon steels – Hyper-eutectoid steels
As the % C dissolved in austenite increases, the iron atoms are pushed further apart. This stretches the chemical bonds that hold the iron atoms together, generating a form of energy called strain energy. There is a limit to how much strain energy the austenite can stand. The amount of C dissolved in austenite when this limit is reached is called the ‘solubility limit’. The solubility limit in austenite at 820 deg C is 1 % C. If an alloy containing 1.6 % C is heated to 820 deg C, only 1 % of this 1.6 % C gets dissolved in the austenite. The remaining 0.6 % C gets incorporated into a new phase called ‘cementite’. This new phase, cementite, has one major difference from austenite or ferrite. It is a chemical compound that exists at only one composition. The chemical element formula for cementite is Fe3C. For each atom of C in the compound, there are three atoms of Fe, giving an atomic composition of 25 atomic % C. The corresponding weight percent C in cementite is 6.7 %.
Other than the limitation to one composition, cementite has several similarities to austenite and ferrite. It is a crystal having its atoms arranged in regularly repeating geometrical arrays. The crystal structure is a little more complex than either the bcc of ferrite or the fcc of austenite and it is well known. Also, it is a separate phase and is present as discrete grains. So, all the excess 0.6 % C in this example at 820 deg C is present as separate cementite grains mixed in with the austenite grains, that is, the microstructure is a two-phase mixture of austenite and cementite.
The portion of the Fe-C phase diagram extended to higher C compositions where cementite becomes important is shown in Fig 4. The region on the temperature-composition map corresponding to austenite is shown as the central dark region. Because cementite exists at only one composition, it is shown on the phase diagram as a vertical line located at its composition, 6.7 % C. It may be seen that the composition axis at the bottom of the diagram has a break in it just beyond 1.2 %, and the value of 6.7 % is located next to the break. If the break were not inserted, the 6.7 % composition would appear around 300 mm to the right. To envision the true diagram, it can be imagined the extending the right portion approximately 300 mm, which expands the shaded two-phase region labeled into a much larger area.
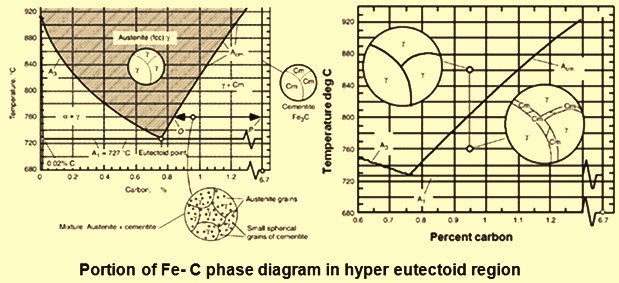
Fig 4 Portion of Fe-C phase diagram in hyper eutectoid region
The line on the diagram named ‘Acm’ defines the solubility limit for C in austenite. It can be seen that at 820 deg C, this line gives a point at 1 % C, which is the maximum amount of C that can be dissolved in austenite at 820 deg C. Alloys having percent C compositions to the right of the Acm line are in the shaded two phase region and consist of a mixture of austenite and cementite grains. For example, steel with 0.95 % C is heated to 760 deg C, the temperature-composition point will be at the open circle in Fig 4 with the horizontal arrowed line passing through it. Because the temperature-composition point lies in the shaded two-phase region, this steel consist of a mixture of austenite having composition O (0.85 % C) and cementite of composition P (6.7 % C). The diagram does not describe how the microstructure will look like. However, experiments show that the microstructure will be as shown at the bottom of the Fig 4. All of the cementite appears as small, spherically shaped grains distributed fairly randomly over the austenite grains, which have much larger sizes and the typical curved grain boundaries.
To further demonstrate the use of the phase diagram in understanding how microstructure changes during heat treatment, an experiment can be considered where the steel with 0.95 % C is heated to 850 deg C and held for 20 minute or so. As shown on the phase diagram of Fig 4, this temperature-composition point corresponds to the single-phase austenite region. Assuming the structure could be observed in a hot stage microscope, the small region under observation at high magnification may consist of just three grains, which would have an appearance similar to that shown in Fig 4.
If the temperature of the hot stage is lowered to 760 deg C, then this temperature-composition point lies in the two-phase austenite – cementite region, which means that cementite grains must form on cooling. Just as is the case for the hypo-eutectoid steel of Fig 3, where ferrite forms on the austenite grain boundaries during cooling, here cementite forms on the austenite grain boundaries during cooling. As shown in Fig 4, the final microstructure has all of the prior austenite grain boundaries from the 850 deg C structure filled with thin, plate shaped grains of cementite. The difference in the microstructure from that shown in Fig 4 (bottom left side), where the steel with 0.95 % C was heated directly from room temperature to 760 deg C. Both microstructures contain the same volume fraction of cementite and austenite, but the distribution of the cementite is quite different. Unlike austenite and ferrite, cementite is very brittle. Consequently, the structure 0f 0.95 % C steel of Fig 4 with its interconnected cementite plates is not as tough as the Fig 4 (bottom left side) structure with its small, isolated cementite grains. Again, this is an example of how heat treatment can change microstructure, which, in turn, changes mechanical properties.
Eutectoid steel – Pearlite
Steels having the composition of around 0.76 % C generate a unique microstructure called pearlite. Fig 5 presents the Fe- C phase diagram on which the area below the A1 line of 727 deg C is shaded dark. This entire area is a two-phase region. Steels cooled slowly into the temperature composition coordinates of this area consist of a mixture of the two phases, ferrite and cementite. The microstructures of steels in this two-phase region vary widely, and pearlite is just one of many microstructures that can occur.
To understand the pearlite microstructure, a steel having C of around 0.76 % is heated in a hot stage microscope to 800 deg C. As shown in Fig 5, the steel consists of all austenite grains after just a minute or two at 800 deg C. After cooling to a temperature below A1 and holding for 5 minutes to 10 minutes or so, the austenite grains are completely replaced by a new set of pearlite grains, as shown in the figure. Contrary to all the grain structures described up to this point, the pearlite grains are not a single phase. Rather, they consist of a mixture of two phases, ferrite and cementite, having a unique microstructure. To observe the true details of the microstructure, a small region within a pearlite grain can be observed under very high magnification, as shown Fig 5 (left side). The structure consists of alternating plates of ferrite and cementite. The ferrite plates are much fatter than the cementite plates, occupying 90 % of the volume compared to only 10 % for the cementite. At the pearlite grain boundaries, there is an abrupt change in the orientation of the plates, as is shown for a real sample in Fig 5 (right side). This microstructure is from a transmission electron microscope at a magnification of 11,000 x.
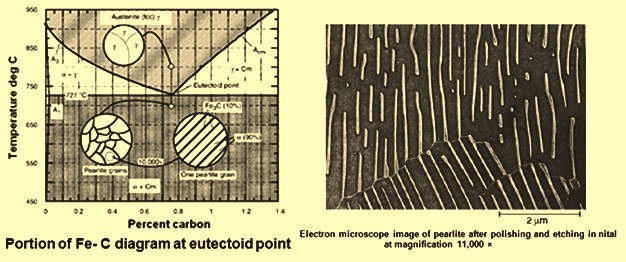
Fig 5 Portion of Fe- c diagram at eutectoid pint and image of pearlite
In this electron microscope image, the cementite plates are the light phase and the ferrite plates are the dark phase. The cementite plates are only 0.1 micrometer thick and are too thin to be resolved on an optical microscope. Although cementite is brittle, pearlite is not, mainly due to the fine size of the cementite plates. If this steel is now cooled from the 700 deg C temperature to room temperature, the microstructure does not change significantly, no matter how slow or fast the steel is cooled. The ferrite remains a nearly pure bcc iron with less than 0.02 % C dissolved in it, and the cementite remains at 6.7 % C with an unchanged crystal structure.
According to the phase diagram, when austenite is cooled below the A1 temperature and held for a short period, the austenite is completely replaced by some form of ferrite- cementite, and on cooling to room temperature, no further changes in the resulting ferrite-cementite microstructure occurs. Austenite is never seen in plain C steels at room temperature. An exception to this rule is quenched high C steels, which contain mixtures of martensite and retained austenite. This means that microstructures containing austenite can only be seen in a hot stage microscope, because the austenite gets replaced by other structures on cooling. At high cooling rates (such as obtained in water and oil quenching), these include the martensite and bainite structures. At air cooling rates and slower (such as furnace cooling), the austenite gets transformed into some form of ferrite- cementite.
The A1, Ae1, Ac1, and Ar1 nomenclature
The Fe-C phase diagram shown in the Fig 2 is called an equilibrium phase diagram. This means that the transformation temperatures given by the ‘A’ lines have been determined at extremely slow cooling or heating rates, where equilibrium conditions are obtained. The A3, Acm, and A1 lines that appear on equilibrium phase diagrams are often shown as the Ae3, Aecm, and Ae1 lines, respectively, where the ‘e’ indicates equilibrium conditions. The absence of the ‘e’ implies equilibrium conditions.
Consider again the process explained for the understanding of the pearlite microstructure. The diagram in Fig 5 predicts that when the austenite grains cool to around 727 deg C, pearlite starts to form from the austenite. This only occurs if the austenite is cooled extremely slowly. At even modest cooling rates such as 3 deg C per minute, the transformation temperature is lowered by approximately 20 deg C. This means that the Fe- C phase diagram can only be used as a rough guide for estimating the transformation temperatures. Not only is the transformation from austenite to pearlite on cooling shifted down in temperature, the reverse transformation from pearlite to austenite on heating is shifted up in temperature. It is possible to demonstrate the magnitude of this shift on cooling and heating by a simple experiment.
The French scientist, Floris Osmond, who is responsible for the name of martensite, is also responsible for the use of the letters ‘r’ and ‘c’ for the shift in the ‘A’ lines on cooling and heating. At the end of the 19th century, he was the first scientist to use thermocouples to measure the effect of heating and cooling rates. The letter ‘r’ is from the French word for cooling, ‘refroidissement’, and the letter ‘c’ is from the French word for heating, ‘chauffage’.
In ‘pure iron’, when austenite changes to ferrite on cooling, heat is liberated, and when ferrite changes to austenite on heating, heat is absorbed. The A3 and the A1 lines of the pure Fe-C diagram are shifted down in temperature by the manganese (Mn) and silicon (Si) present in a typical steel having a composition of with C- 0.18 %, Mn-0.75 % and Si- 0.2 % to the values of A1 as 725 deg C and A3 as 824 deg C. The heating data show that at around 737 deg C, the rate of temperature rise abruptly decreases. This is due to the heat absorbed by the sample as the pearlite part of the steel transforms to austenite. It means that the A1 line has shifted up by 12 deg C, from 725 deg C to 737 deg C. It is customary to mark the actual temperature of the transformation on heating as Ac1. The amount of the upward shift depends on the heating rate. If the heating rate is increased above the value of 40 deg C per minute, the value of Ac1 increases.
On cooling, an opposite effect occurs. The heat liberated in the typical steel having a composition of with C- 0.18 %, Mn-0.75 % and Si- 0.2 % when austenite transforms to ferrite or pearlite slows down the rate of decrease. This effect is visible for both the austenite to ferrite transformation below the A3 temperature and the austenite to pearlite transformation below the A1 temperature. The former transformation begins to occur at 762 deg C, which is 62 deg C below the A3 temperature of 824 deg C, and the latter occurs at 652 deg, which is 73 deg C below the A1 temperature of 725 deg C. It is customary to mark the actual transformation temperatures that occur on cooling as the Ar3 and Ar1 temperatures. It can be seen that the cooling rate as shown in Fig 6 is three times larger than the heating rate. This larger rate accounts for the increased shift in the A1 temperature from -73 deg C on cooling to only + 12 deg C on heating. The temperature range of Fig 6 is did not extend high enough to measure the increased A3 temperature, which is called the Ac3 temperature.
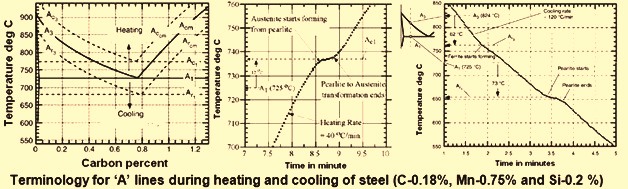
Fig 6 Shift in ‘A’ lines during heating and cooling of steel
The left side graph of Fig 6 shows a graphical summary of the shift up of the ‘A’ lines on heating, with markings having subscript ‘c’ added, and the shift down on cooling, with the markings have the subscript ‘r’ added. These shifts in transformation temperatures can become important in manufacturing operations involving rapid heating and cooling. An example is the shift up in transformation temperature with heating in processes such as flame and induction hardening.

Comments on Post (1)
KGK Murthy
Very good and detailed article on Fe C Equilibrium diagram…