Data based Decision making in a Steel Organization
Data based Decision making in a Steel Organization
During the operation of a steel plant a large amount of data gets generated. In a steel organization where there are a large number of units working in conjunction with each other and where there are a large variety of processes taking place simultaneously at all the times, the generated data is many times that of a normal organization. This huge amount of data need to be coordinated, collected, integrated, and analyzed in order to ensure that proper decisions are taken for the smooth running of the units, processes and ultimately the steel organization. Decisions taken based on analyzed data ultimately help in providing the organization a competitive advantage.
Even without disturbances, unexpected situations and current rapid production changes in a steel organization are challenging for operators, maintenance personnel and production planners and management who make decisions. Hence, there is a need to have a systematic methodology to structure the decision making situations and to find out the relevant information and other needed factors. The performance of decision making depends on the quality of the decisions taken. Structuring the decision making situation means that all the relevant factors are considered and not forgotten, and action choices are found out and their effects are evaluated. This kind of approach produces cost-effective decisions. Data if collected and stored is only a lot of information available. For data based decision making, the data is to be structured and processed. Inter dependency of the data need to be understood and proper integration is to be done to have meaningful data analysis for decision making.
Data is good, but only as good as the systems in place to collect summarize, analyze, make decisions, make action plans, implement interventions, and sustain implementation. Very often, employees of the steel organization are not aware how to channel the large amount of data towards decision making. Employees are required to be trained in collection, analyzing, and in use of the data for the decision making process. Further there is to be balance between requirement, accessibility and reliability of the data for effective decision making.
Data based decision making is an important aspect of the management in a steel organization. It is to be an ongoing process of analyzing and evaluating information for the management for taking important decisions and actions since it helps in monitoring the processes, solving of the problems, and reviewing of the systems and practices. The analysis of the data is to highlight areas of concern where decisions for correction are needed.
Data based decision making not only helps in the smooth running of the organizational processes, but it also helps the management to take decision towards improvement in the working of the processes. Progressive management of the steel organization use data to define needs, set goals, plan interventions, and evaluate progress. It knows that to be effective, it has to use the data extensively to guide the process of the decision making. It has to use the array of data to monitor not only for the smooth running of the organization, but also to know how well the organization is progressing towards meeting its goals and objectives. Continuous improvement in the organization hinges on continuous data based decision making.
The steel organization management, which has the capabilities of data based decision making, understands the range of data that is needed for improvement. It knows some fundamental principles of measurement and assessment and can implement data-analysis skills. It uses a multitude of strategies to analyze data to propel the organization towards success and achievement of its objectives. It uses technology to support the use of data. It engages the employees of the organization in using data to analyze strengths, weakness, threats, and opportunities for the improvement of the organization. It understands that the data-driven decision making is critical for the organization to meet the needs of employees and stake holders and to reach accountability expectations.
Use of the verifiable data instead of intuition to make decisions is a valuable strategy for the management in the steel organization. It increases the effectiveness of management decisions. It is generally seen that data based decision making increases the organizational performance by increasing substantially the output and the productivity. Effectively using data to make decisions requires at least two key elements. First, the data based decision making process must be embedded into the organization so that the employees value and embrace the use of data over intuition in developing and implementing strategies. Such a process enables individuals to take appropriate and timely actions. Second, it requires a coordinated process of sequential data based decision making activities in which the organization collects, analyzes, and uses data. Each stage is important. If data are not collected, organizations cannot analyze information to draw conclusions. If data are not analyzed consistently and correctly, employees might use it to draw incorrect conclusions. Finally, if the results of data analysis are not incorporated fully into decision making, the efforts made on collection and analysis of the data goes waste.
There are five key reasons for data based decision making in the steel organization. These are (i) to work toward continuous improvement, (ii) to meet accountability requirements, (iii) to focus on efforts and to monitor progress, (iv) to develop a sense of harmony between the processes and (v) to develop a sense of community amongst the employees through organizational learning and data sharing.
There are several impediments for the use of data for the effective decision making. These are given below.
• Too many sources of data which are not properly integrated for the benefit of the entire organisation.
• Shortage of skilled people to analyze the data properly.
• Too much time is needed to analyze the data.
• Employees are having habit of working with intuition.
• Management does not view data sufficiently and strategically.
• Large efforts are needed for storing, retrieval and analysis of data.
• Unstructured content of the data is too difficult to interpret.
• Collection and storage of data is too complex.
• Data may not be complete for analysis and there may be missing links requiring assumptions to be made for carrying out the analysis.
Perceived benefits of harnessing the large data available in the steel organization for decision making are given below.
• Working of the organization becomes more structured
• More complete understanding of market conditions and evolving trends in the customers’ requirements
• Better investment decisions especially with respect to product development
• More accurate and precise responses to customers’, employees’ and other stake holders’ needs
• Consistency of decision making and greater group participation in shared decisions
• Focusing resources more efficiently for optimal returns
• Efficient operation with higher productivity of the organizational processes
• Generation of peaceful and harmonious working environment within the organization
• Smooth achievement of the organizational objectives
• Faster growth of the organization
• Competitive advantage for the organization
• Common basis is available that is one true starting point for evaluation
• Better risk management
Steps for data based decision making
There are several steps which can be distinguished for data based decision making and are described below. The steps are repetitive, in that feedback from later steps may result in additional work in earlier steps.
• Data requirements – The data necessary as inputs to the analysis are specified based upon the requirements of those directing the analysis or the employees who are to use the product of the analysis. Data can be numerical or categorical.
• Data collection – Data can be from different sources usually from the custodian of the data. The data need to be authentic and must be acceptable. The data can be from daily, weekly, monthly or annual reports, or it can be a print-out of a process automation system. In certain cases like failure analysis or accident analysis data can be obtained through interviews.
• Data processing – Raw data which is collected initially need to be processed or organized for analysis. As an example, it may involve placing data into rows and columns in a table format for further analysis, such as within a spreadsheet or statistical software.
• Data cleaning – Once processed and organized, it can be noticed that the data is incomplete, or may contain duplicates, or contain errors. Hence there can arise the need for data cleaning which is the process of preventing and correcting these errors. Common tasks include record matching, de-duplication, and column segmentation etc. Unusual amounts above or below pre-determined thresholds need also to be reviewed. There are several types of data cleaning that depend on the type of data. Quantitative data methods can be used to get rid of likely incorrectly entered data.
• Exploratory data analysis – Once the data is cleaned, it can be analyzed. Employees analyzing the data can apply a variety of techniques referred to as ‘exploratory data analysis’ techniques to begin understanding the messages contained in the data. The process of exploration may result in additional data cleaning or additional requirement for data, so these activities can be repetitive in nature. Descriptive statistics such as the average or median can be generated to help understand the data. Data visualization can also be used to examine the data in graphical format, to obtain additional insight regarding the messages within the data.
• Modeling and algorithms – Various mathematical formulas or models called algorithms can be applied to the data to identify relationships among the variables, such as corelation or causation. In general terms, models can be developed to evaluate a particular variable in the data based on other variable(s) in the data, with some residual error depending on model accuracy. Sometimes inferential statistics techniques are used to measure relationships between particular variables. Employees analyzing can also attempt to build models that are descriptive of the data to simplify analysis and communicate results.
• Data product – A data product is the output of the data analysis and is based on a model or algorithm. The output is generated based on the inputs and is to be used for the decision making.
• Communication – Once the data is analyzed, the resukts may be reported in the required formats to the users of the analysis to support their requirements. The users may have feedback, which results in additional analysis. As such, much of the analytical cycle is repetitive. When determining how to communicate the results, the employees analyzing the data can consider data visualization techniques to help clearly and efficiently communicate the message. Data visualization uses information displays such as tables and charts to help communicate key messages contained in the data. Tables are helpful to a user who might lookup specific numbers, while charts (e.g., bar charts or line charts) can help in explaining the quantitative messages contained in the data.
The process of data analysis ultimately has an impact on the organizational performance. It needs to be part of a cyclical process. When data analysis is viewed as one step in a system then its use becomes integral to the workings of the organization. Without a process, data analysis can be only an event. Time is spent viewing and analyzing data, but there is no intended result other than to comment on what is observed. Although time is not wasted, data viewed without a process is not likely become a catalyst for change. Data analysis to be a cyclic process has the following four built in steps.
• The first step – Data analysis is a foundational part of the improvement cycle. Data provides evidence of system successes and challenges. The intent of analysis is to gather results that illustrate the effectiveness of current methods, procedures, and structures. The Five W’s (who, what, when, where, why) provide a summary of analysis components. ‘Who’ means the employees need to be involved in the analysis process. For data analysis to become integral to the workings of the organization, data analysis output must be shared with all the key stakeholders. Although the level and type of data may differ, opportunities for review are to be provided to all the relevant employees or groups of employees. ‘What’ is that data which need to be analyzed. A combination of data needs to be collected and available to create a balanced picture of the organization. Data is to be viewed at various levels and the concerned departments and is to include a balanced view. ‘When’ indicates the time when data need to be analyzed. Data reviews need to take place depending on the requirements. This can be weekly, monthly, or at select times of the year. Collective data is to be reviewed annually. When there is a problem then appropriate data need to be reviewed to assist in solving the problem. Data also need to be reviewed during program evaluation periods. ‘Where’ represents the place of the data collection. Data need to be collected at places where it is generated and where it is to be most effectively used. The data review group is to consist of members who are affected by the results. ‘Why’ indicates the necessity of data analysis. Data is to be reviewed to evaluate all the aspects of the necessity.
• The second step – The purpose of the process of data analysis is to review data to generate questions, ideas, conclusions, and comparisons, which, collectively, aid in the creation of an improvement plan. The intent of the plan is to take decisions about the actions based on the results of the analysis. Improvement plans are not about what management wants to do, or what the management thinks they might want to focus on, but what the data tell them they need to do to increase the achievement of the organization. Long term and short term improvement goals are to be established. Generating plans to reach goals requires the involvement of employees and departments of the organization. At each level, plans need to be created that reflect the data. The improvement plans at the organizational and department levels are to be developed to reflect challenges represented in the data. Both the organizational plan and the department plans are to be mutually supportive. Department plans are to be designed to reflect the department data as well as to support the organizational goals.
• The third step – Plan implementation requires the involvement of all the employees who are reflected in and affected by the plan. Departments are to be knowledgeable and supportive since they play key roles in the plan and its implementation. The involvement and support of the employees is essential for the greatest impact on achievement. Analysis, planning, implementation, and assessment, is to parts of a constant and continuous cycle and is to be integrated with the short term and long term plans of the organization.
• The fourth step – Assessment takes a variety of forms and is an ongoing step. Types and times of assessments are identified during the planning process. The goal is to assess the effectiveness of the plan throughout implementation. These assessment tools create a focus to evaluate the key components of the plan.
The above four steps of the cyclic process in the data based decision making are shown in Fig 1. Within the circle as an example, the four steps at department levels are shown for the four departments.
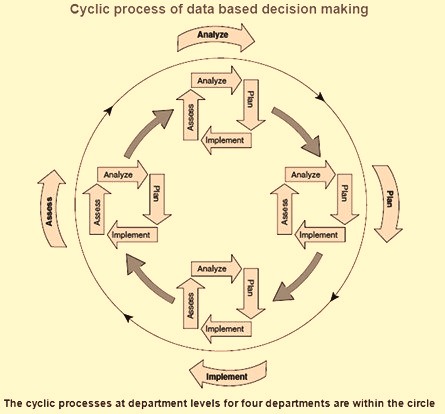
Fig 1 Four steps of cyclic process

Leave a Comment